-edit-(2).jpg;w=960;h=640;bgcolor=000000)
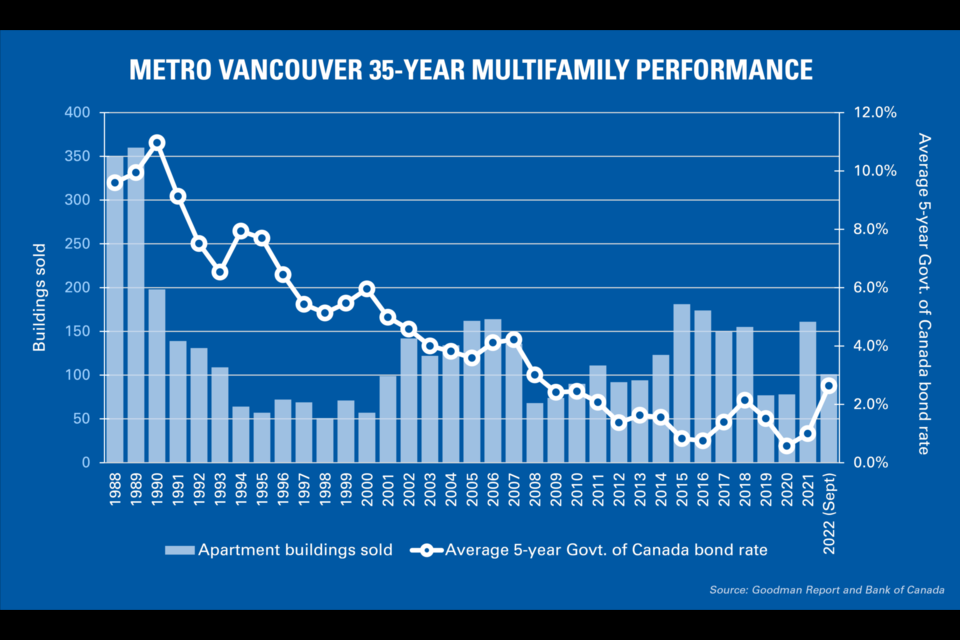
Recently, Goodman Commercial took time to review our newsletters from the past 35 years. We wanted to chart Metro Vancouver apartment building sales activity to see what past trends could tell us about the future.
What we found: The factor that popped up in every market downturn was government intervention.
Looking back, 1988 and 1989 were record years for multifamily transactions in Metro Vancouver. The Goodman Report recorded over 700 sales: 350 in 1988, 360 in 1989. To put that into perspective, transaction levels haven’t surpassed even 200 in any year since. Over the 32 years starting in 1990, the market has averaged 113 sales per year. 2021 saw 161 transactions, fewer than 50 per cent of either 1988 or 1989 volumes.
You’d think rates would have been near zero to incite such a sales volume boom. However, average five-year Government of Canada bond yields in 1988 and 1989 were 9.6 per cent and 9.9 per cent, respectively. Bank prime rates, meanwhile, averaged 10.7 per cent in 1988 and increased to 13.3 per cent in 1989. These rates were considered low for the time, a far cry from the early 80s when bank prime hit 22.75 per cent.
After that, transactions plummeted, dropping to 198 in 1990 (down 45 per cent in one year) and further to below 100 on an annual basis throughout the 90s. From 1994 to 2001, annual transaction volumes averaged only 67 sales per year. During this time, five-year government bond yields had declined from over 10 per cent to the 5 per cent to 6 per cent range. Bank prime rates went as low as 4.75 per cent.
If sales volumes were higher than ever in a period of high interest rates and falling interest rates didn’t spur more transactions, we might wonder what caused these major swings in investment activity in Metro Vancouver’s multifamily market.
Here’s where government intervention comes in.
Federally, the capital gains tax was increased from 50 per cent inclusion to 66.67 per cent in 1988, then to 75 per cent in 1990. This catalyzed a huge sell-off as owners looked to get out. In 1991, a provincial NDP government came to power, promising to increase tenant rights and impose rent control. Actual rent control legislation wasn’t adopted until 1995, but by then the investment community had been long expecting it.
Transaction volumes didn’t recover until 2001–02. Whether coincidentally or not, capital gains tax inclusion rates were reduced back to 50 per cent in 2000, and a new business-friendly provincial government took power in 2001. These factors reinfused some confidence into the market, following the dotcom bust as investors looked for safety.
Multifamily remained active until 2008, when the subprime mortgage crisis in the United States threw global markets into disarray.
After averaging 157 transactions per year from 2014 through 2018, the market plunged to 77 in 2019 and 78 in 2020. Another significant shift in policy occurred in 2018 shortly after the provincial NDP took control of government. They introduced several new taxes to cool demand for residential real estate, increased the foreign buyers’ tax and lowered the allowable maximum rent increase from 4.5 per cent to 2.5 per cent, which affected 2019 volumes. 2020 transactions were stunted by three to six months amid challenges from the pandemic.
And so, to today. In 2022, sales volumes are down significantly over 2021 as the Bank of Canada raises rates aggressively to fight inflation. While history doesn’t necessarily indicate the future, looking back over the last 35 years has suggested that at a minimum, when government intervenes, the only certainty is change.
- Mark Goodman and Cynthia Jagger are partners in Goodman Commercial, specialists in the multi-family market and publishers of the Goodman Report.


